Loading page…
Your market. Every angle.
Charts, order flow and AI research, together.
Feeds: Connecting. Only newly published major headlines trigger alerts, one at a time. No replay of older news. Feeds are checked every 15s.
The news behind the move.
Connecting to news feed
Gold / XAUUSD
Live quote unavailableOpen Gold in the terminal ↗Published times in IST · News and quote feeds are separate.
🏢 S&P 500 & Global Stock Exchange Sector HeatmapALL SECTORS
Sectors: Tech, Finance, Healthcare, Energy, Industrials, Utilities, Real Estate · Zoom & Expand EnabledGautam QuantTerminalAI-powered quant research platform
Read the whole market.
From the first signal to a tested idea — one connected research workspace.
Gautam SinghFounder · Lead architect
Loading calendar…
Loading insider transactions for AAPL…
Follow your marketGold / XAUUSD ↗Silver / XAGUSD ↗Bitcoin ↗Ethereum ↗Metals use clearly labelled futures proxies.
A view for every move.
Start with the wider market. Go all the way down to the order flow. Keep your research, chart work and testing in the same place.
Start wide. Find the sectors moving together, the outliers and the instruments worth a closer look.
Explore Prediction Chart ↗Follow the large orders.
Switch between Gold and Bitcoin. Explore large executions, buyer and seller flow, and the live price book.
Inside the move.
Price is one part of the story. Explore the executions, participation and resting liquidity behind it.
Open Flow Studio ↗Inside Gautam QuantTerminal
Every tool, built for one trader.
Twelve connected workspaces — from the first scan to a tested strategy. Create a free account to open any of them.
01 / 12
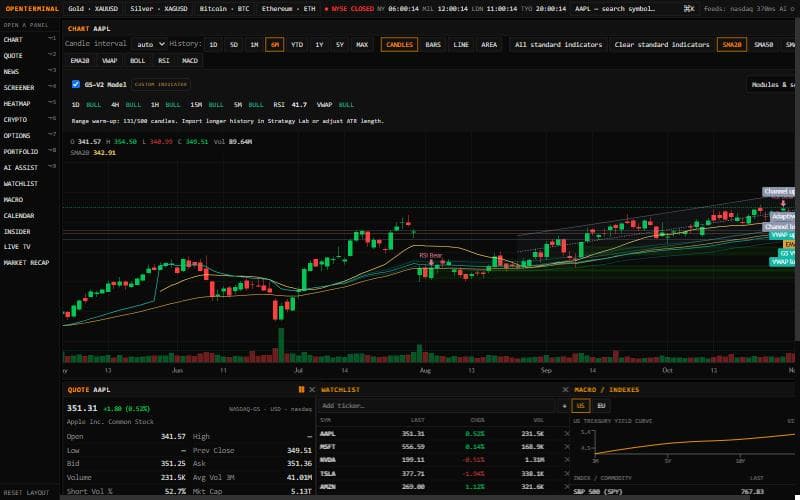
Multi-panel workspace
Advanced Terminal
Charts, quotes, watchlist, macro, economic calendar and SEC insider trades in one keyboard-driven terminal.- GS-V2 model overlay
- 1D → 5Y history
- Linked panels
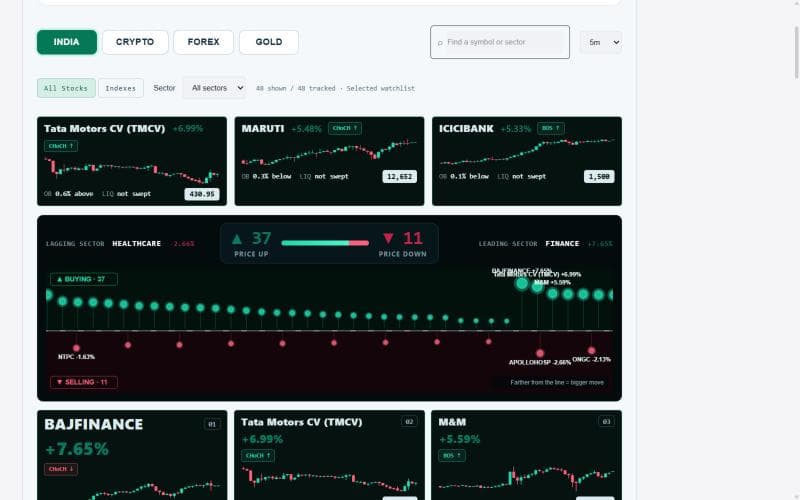
India · Crypto · Forex · Gold
Smart Money & Order Flow
Who is leading — buyers or sellers — with CHoCH/BOS structure, order blocks and liquidity sweeps on every card.- Sector leadership
- Structure breaks
- Live session clock
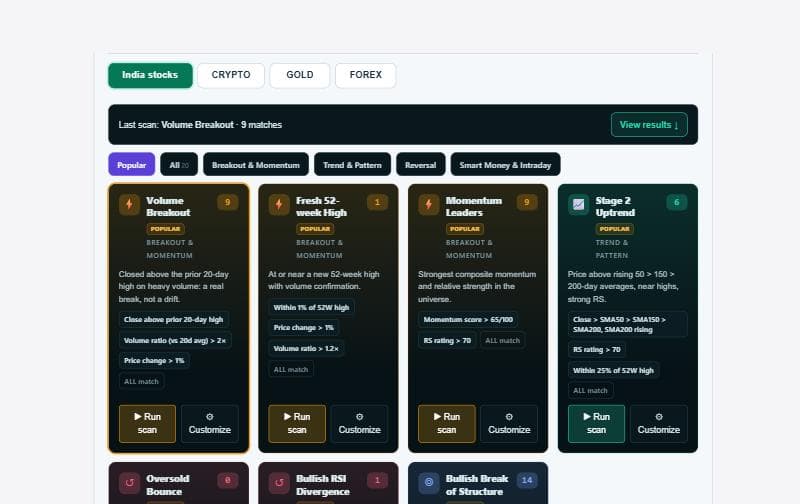
Pre-built scans
Stock Scanner
Volume breakouts, 52-week highs, momentum leaders and Stage 2 uptrends — run one click, or customise the rules.- 20 ready scans
- India · crypto · gold · forex
- Auto-refresh
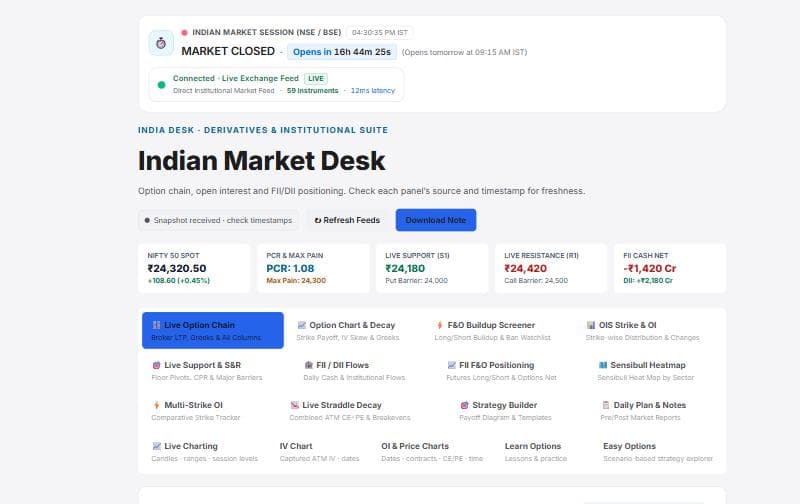
NIFTY F&O
Indian Market Desk
Live option chain, PCR and max pain, FII/DII flows, OI buildup and straddle decay in one derivatives desk.- Option chain
- FII / DII flows
- Support & resistance
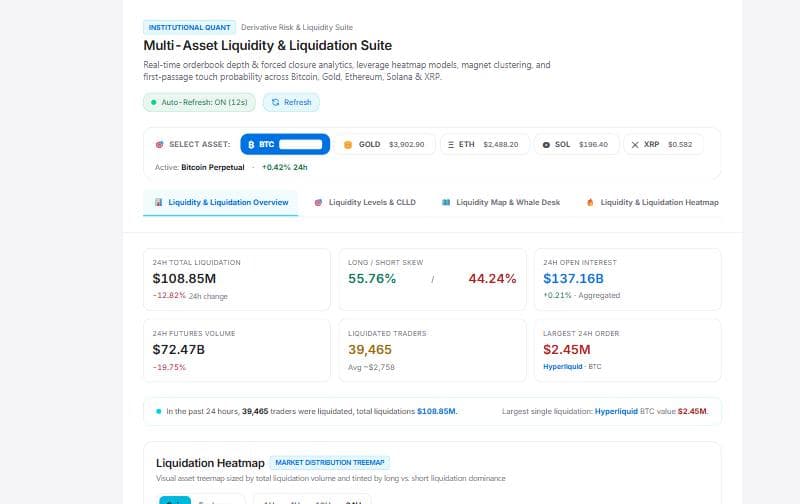
Derivatives risk
Liquidity & Liquidation Suite
24h liquidations, long/short skew, open interest and treemaps across Bitcoin, Gold, Ethereum, Solana and XRP.- Liquidation heatmap
- Whale desk
- Max pain
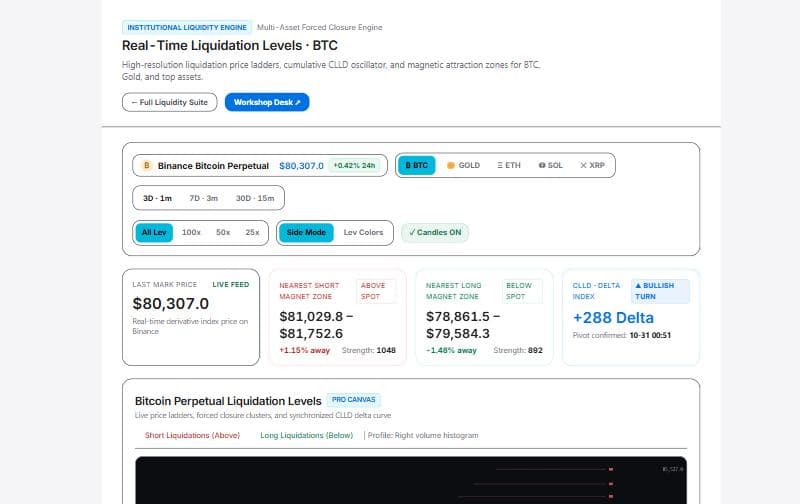
CLLD engine
Liquidation Levels
Forced-closure price ladders and magnet zones above and below spot, with the CLLD delta pivot.- Magnet zones
- 25×–100× leverage
- Delta pivots
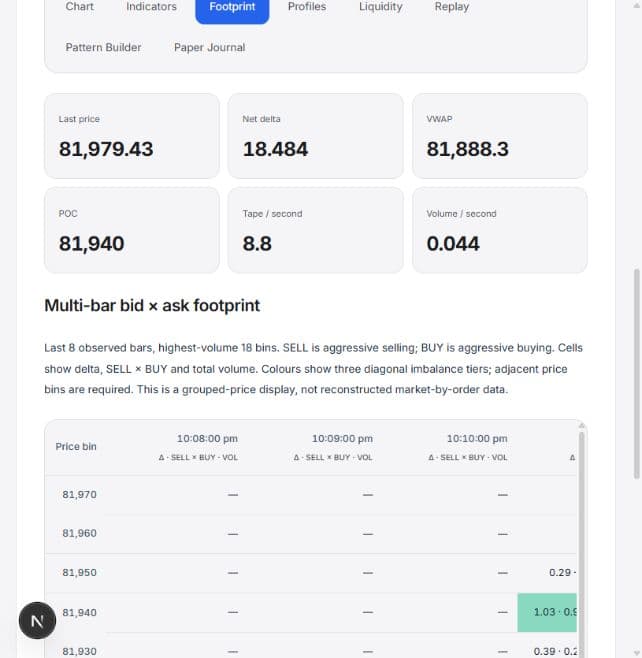
Footprint & DOM
Flow Studio
Bid × ask footprints, delta, VWAP and POC, volume profiles, replay and a paper journal.- Footprint bars
- Profiles
- Pattern builder
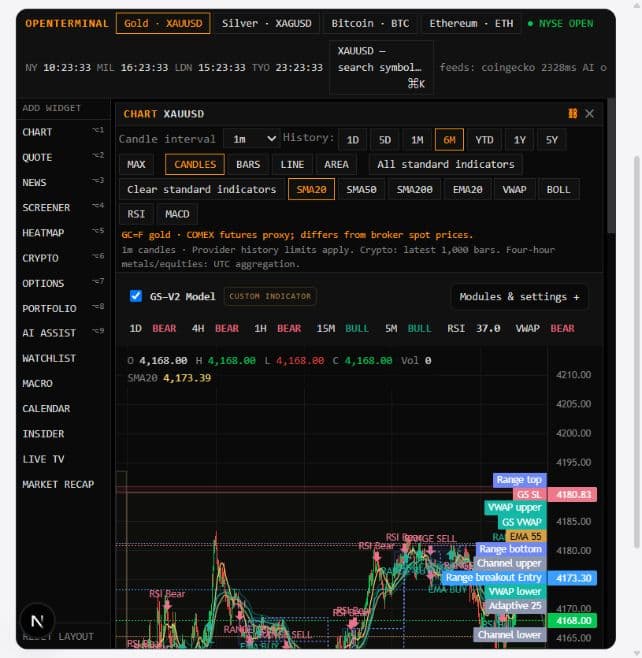
Proprietary model
GS-V2 Indicators
Order blocks, ranges, adaptive trend, VWAP bands, RSI divergence and EMA-55 retests drawn on the chart.- Range breakouts
- Multi-timeframe bias
- Entry / SL levels
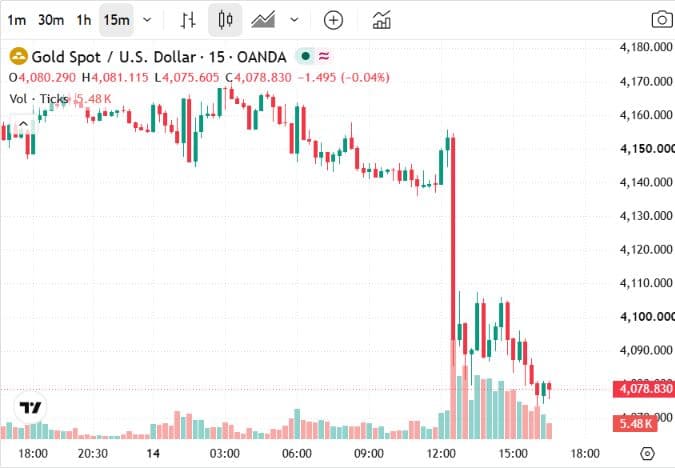
Prediction chart
Model Chart Workshop
Pick an exchange, instrument and model; inspect completed candles, scenarios and simulated setups.- Any instrument
- Model scenarios
- Completed candles

AI research
12-Agent AI Terminal
Twelve specialist agents — technicals, fundamentals, sentiment and risk — debate one idea and reach a consensus.- Consensus view
- Risk agent
- Source-linked
Backtesting
Strategy Lab
Write the rules, test them on historical candles and inspect every simulated trade.- Rule builder
- Trade-by-trade results
- Equity curve

Cross-market setups
Time Machine
Day Trader setups across crypto, Indian, US index and forex markets, ranked by odds and tracked to stop or target.- 27 assets hourly
- One trade per asset
- Tracked outcomes
Every tool, connected.
A place to observe, question, test and learn. Find the workspace that fits your next step.
Liquidity & Liquidation Suite
Orderbook liquidity depth, forced liquidation ladders, CLLD reversal markers, 3-model heatmaps and max pain.
MarketsSmart Money & Order Flow
Buyer/seller leadership, top gainers and losers, sector filters, market structure, FVGs and instrument charts.
MarketsSmart Money India
Indian stocks and indices, sector leadership and instrument-specific structure. Read feed coverage and timestamps.
MarketsIndia Desk
Pre/post-market charts, FII/DII buying and selling, support/resistance, OI/PCR, results, ban list and rupee position sizing.
MarketsMarket news
Source-linked news and market context. Provider availability and publication dates apply.
IntelligenceModel chart
Choose an exchange, instrument and model; inspect completed candles, scenarios and simulated setups.
IntelligenceOne workspace. Your pace.
Explore for free. Get the model's signals, or connect your broker and let the model trade for you. Monthly or yearly, in INR or USD.
Know your tools.
Where does the market data come from?
The heatmap refreshes every five seconds: TradingView stock scans and Hyperliquid crypto/metals perpetual mark prices. The time shown is our last successful fetch, not an exchange quote timestamp. Stocks may be delayed or unchanged outside market hours. Search covers the returned universe, up to 1,500 US stocks; the map displays the largest 65 (25 on mobile). A saved US snapshot is labelled when live data is unavailable.
Is Gold the same as my broker’s XAUUSD?
OpenTerminal currently uses GC=F and SI=F COMEX futures proxies for Gold and Silver. These are labelled in the chart and can differ from a broker’s spot XAUUSD or XAGUSD price. Always check the instrument and source.
Can I test a strategy before using it?
Strategy Lab lets you define rules and inspect historical results. Flow Studio includes replay and a paper journal. Data coverage, fees, slippage and execution assumptions all affect what a historical result means.
Does GS-V2 place orders for me?
GS-V2 displays chart studies, completed-candle signals and Entry/SL/TP markers. It does not submit broker orders. Its native implementation is not a verified bar-for-bar TradingView replica.
Where should I start?
OpenTerminal is the quickest way to explore the market. Use Trading Learning for the concepts, Flow Studio for order flow, and the AI terminal for a structured research session. Broker and model connections have their own workspace settings.
Find your next view.
The market keeps moving. Bring a little more context to your next decision.